
Climate Resilience and Adaptation
Climate risks are getting worse. Floods and sea level rise are showing up as water in streets and homes, sometimes blocking roads and overwhelming local drainage. Droughts and extreme heat strain water supplies, crops, and natural habitats. Wildfires, fueled by hotter and drier conditions, create more smoky days with unhealthy air quality, and cause emergencies that stretch community resources.
State government is interested in protecting against future climate hazards. We define adaptation as an action that helps to protect people or property from future climate hazards. Resilience is defined as being prepared, because adaptation was considered. Therefore, we take adaptation actions to increase overall climate resilience, so that when a hazard occurs, the damage is as light as possible, and recovery is faster and easier.
Climate adaptation is important, but measuring progress is difficult because climate adaptation is a complex topic. What information do we need to know for adaptation? How far into the future can we accurately predict? What “counts” as an adaptation project? What, exactly, should we be adapting to? These questions have no single answer for every place. Depending on where you are, you need different climate risk solutions.
Co-benefits of California Climate Investments Projects
California Climate Investments projects reduce greenhouse gas (GHG) emissions, and also create “co-benefits” for individuals, households, businesses, and communities. Some example co-benefits include: fuel and energy cost savings, habitat conservation, and more. These co-benefits are quantified using calculator tools created by CARB. State agencies administering California Climate Investments programs work closely with CARB to develop these calculators. By asking specific questions that can be answered by looking carefully at publicly-available data, CARB can assess climate adaptation co-benefits provided by California Climate Investments projects. CARB is developing the California Climate Risk and Adaptation Index (CalCRAI) to assess adaptation co-benefits.
California Climate Risk and Adaptation Index (CalCRAI)
CalCRAI is a method to estimate the climate hazards and adaptation ability in California. CalCRAI is an index of risk, which allows users to see where climate risks are the worst, and which places may need the most help to prepare. The method is based on the "Cumulative Resilience Screening Index" (CRSI) made by the US Environmental Protection Agency. CalCRAI works very similarly but is customized for California. The index is similar to a ranking, where a high number means that a place has more resilience than places with a lower number. CalCRAI was developed by Eagle Rock Analytics Inc. (contract 22STC003).
Below is a walkthrough of how CalCRAI works, with the questions CalCRAI asks and how it answers them.
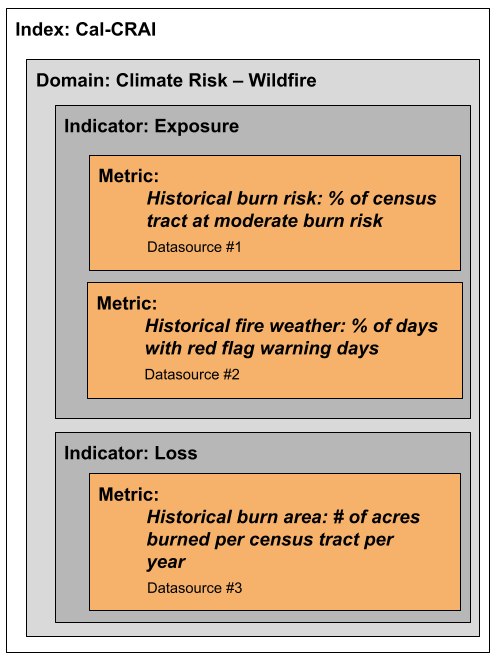
An example to illustrate the structure of domains, indicators, and metrics within CalCRAI.
Hazard Score: “What is the chance of a climate hazard here, and if it happens how bad will it be?”
Hazard Score combines the risk of floods, droughts, sea-level rise, wildfires, and extreme heat. This allows CalCRAI to consider all 5 risks at once, while other climate risk tools often examine one hazard at a time. Users can also adjust CalCRAI domains to prioritize one hazard for management (see section below on “weighting factors.”)
Hazard Score is the product of “exposure” multiplied by “loss.”
Loss: “What level of damage would a climate hazard cause?”
Calculated from historic data, loss estimates the potential casualties and damage from a hazard.
Exposure: “What is the chance of any climate hazard happening here?”
Exposure is calculated using forward-looking climate projections, exposure estimates the chances of a climate hazard occurring in the future.
Loss and Exposure are indicators and each indicator is composed of metrics. A high hazard score indicates a high chance of climate hazards occuring or historically high losses associated with past hazards, or a combination of both. The diagram above shows the metrics within the “loss” and “exposure” indicators for the specific climate hazard wildfire. The overall hazard score is made of this same structure of metrics and indicators for each of the five climate hazards.
Community Capacity: “How well prepared is this place for climate hazards?”
This value consists of four domains: (1) Governance, (2) Built Environment, (3) Natural Systems, and (4) Society and Economy.
Governance:
“How much does government— at all levels— contribute to resilience?” This domain includes metrics of management policies, emergency plans and response, and insurance coverage. A higher score here means that the local government and communities could respond effectively to an emergency.
Built Environment:
“What does the infrastructure in this place do to enhance resilience?” This domain includes metrics of housing quality, transportation such as roads and traffic, and utilities such as water, internet, and electricity. A higher score here means that the housing and infrastructure meet the area’s needs and are in good condition.
Natural Systems:
“How resilient is the natural environment here, and does it contribute to the community’s resilience?” This domain includes metrics of ecosystem health and biodiversity. A higher score means that the natural environment is healthy and contributes to resilience benefits.
Society and Economy: “How resilient are the attributes of the population?”
This domain includes metrics on the population itself: health, wealth, employment, and related metrics. A higher score indicates a healthier, wealthier population.
These four domains are combined to create the Community Capacity Score. A higher community capacity score implies that a place is better prepared to withstand climate hazards.
CalCRAI Score
“What can we learn from considering all of the domains at once?”
All of the domains are calculated to fit a range between 0 and 1, where 0 is the lowest score in the state and 1 is the highest.
The CalCRAI score is the ratio of the community capacity score to the climate hazard score. It can be a number higher than 1, with no upper limit. A high CalCRAI score means that a place is more resilient relative to its climate risks than other places in the state. It is important to remember that this number is not a probability; A score of 1 does not mean a 100% chance of a hazard or 100% perfect resilience. Instead, these numbers are an index of risk, relative to each other.
Weighting Factors
“How can we plan for a specific risk?”
CalCRAI is designed as a general purpose tool, but users can also adjust CalCRAI domains using a system of weighted averages to create analyses specific to their work. For example, a scenario that prioritizes wildfire management is available. Each hazard scenario does not completely ignore the other hazards. Instead, it was intentionally developed to ensure realistic values by reducing how important the other hazards are in comparison. The wildfire scenario also includes substantial drought weighting since these hazards are both correlated with dry conditions, while the importance of flooding is reduced.
These are offered as additional options to allow more analyses, but the default CalCRAI weights all hazards equally.
How else can we measure climate adaptation and resilience?
There are many ways to look at climate resilience, so we also include a chart comparing CalCRAI to other State climate resilience tools.

An example of how weighting factors are applied and can have different effects for different hazards. In (a), a score is modified by x1.25 to show how less vegetation can reduce the spread of wildfire. In (b), that same increase in paved surfaces also increases flood risks.
Explore CalCRAI Scores by Project Type for California Climate Investments
The interactive chart below displays all CalCRAI scores for places where California Climate Investments projects have been implemented. They are organized by sector, category, and project expenditure.
Coming Soon: Interactive map. Look up CalCRAI’s estimates for any location in the state and understand what it shows.
Download the data:
CalCRAI Scores Data Tables: California Climate Risk and Adaptation Index Metric Files and Metadata, v1
Scripts (Python): GitHub - Eagle-Rock-Analytics/carb-climate-index: Code associated with the California Climate Risk and Adaptation Index (Cal-CRAI)